Difference Between Spreadsheet Software and Charting
Summary: Difference Between Spreadsheet Software and Charting is that Spreadsheet software allows users to organize data in rows and columns and perform calculations on the data. These rows and columns collectively are called a worksheet. While another standard feature of spreadsheet software is charting, which depicts the data in graphical form.
Spreadsheet Software
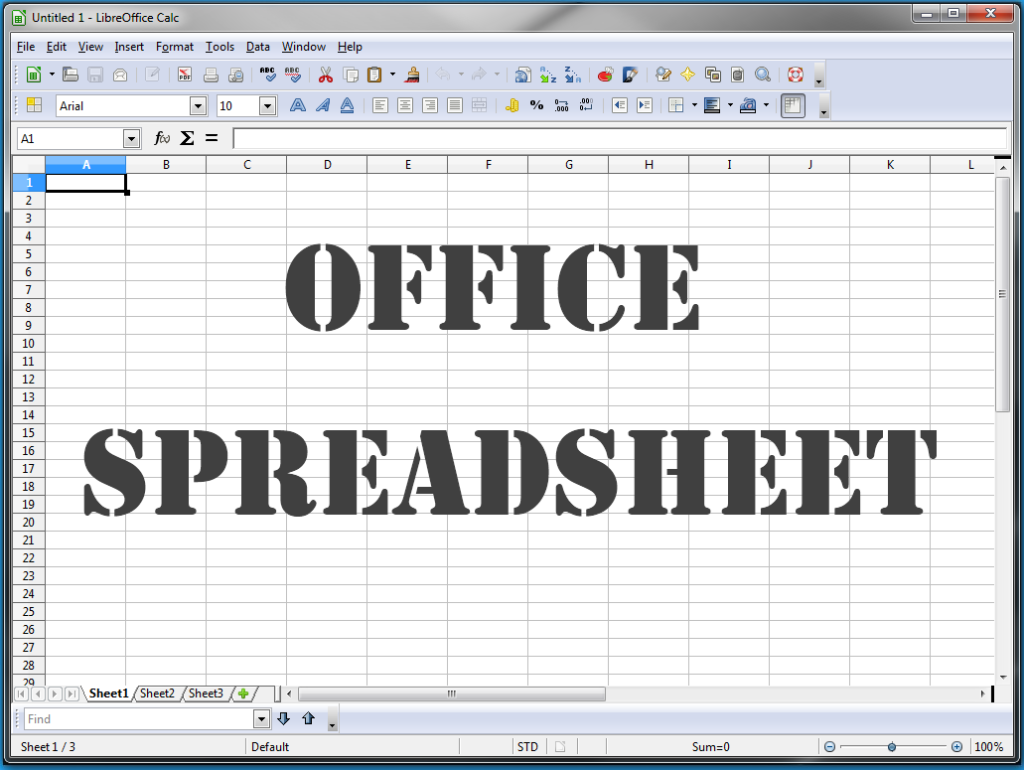
Spreadsheet software allows users to organize data in rows and columns and perform calculations on the data. These rows and columns collectively are called a worksheet. Most spreadsheet software has basic features to help users create, edit, and format worksheets. The following sections describe the features of most spreadsheet programs.
A spreadsheet file is similar to a notebook that can contain more than 1,000 related individual worksheets. Data is organized vertically in columns and horizontally in rows on each worksheet. Each worksheet usually can have more than 16,000 columns and 1 million rows. One or more letters identify each column, and a number identifies each row. Only a small fraction of these columns and rows are visible on the screen at one time. Scrolling through the worksheet displays different parts of it on the screen.
A cell is the intersection of a column and row. The spreadsheet software identifies cells by the column and row in which they are located. Cells may contain three types of data: labels, values, and formulas. The text, or label, entered in a cell identifies the worksheet data and helps organize the worksheet. Using descriptive labels, such as Gross Margin and Total Expenses, helps make a worksheet more meaningful.
Charting
Another standard feature of spreadsheet software is charting, which depicts the data in graphical form. A visual representation of data through charts often makes it easier for users to see at a glance the relationship among the numbers.
Three popular chart types are line charts, column charts, and pie charts. A line chart shows a trend during a period of time, as indicated by a rising or falling line. A column chart, also called a bar chart, displays bars of various lengths to show the relationship of data. The bars can be horizontal, vertical, or stacked on top of one another. A pie chart, which has the shape of a round pie cut into slices, shows the relationship of parts to a whole.
Also Read:
Difference Between Word Processing Software and Spreadsheet Software
Difference Between Landscaping Software and Mapping Software
Difference Between System Software and Utility Programs
Difference Between Application Software and Utility Programs



Leave a Comment
You must be logged in to post a comment.